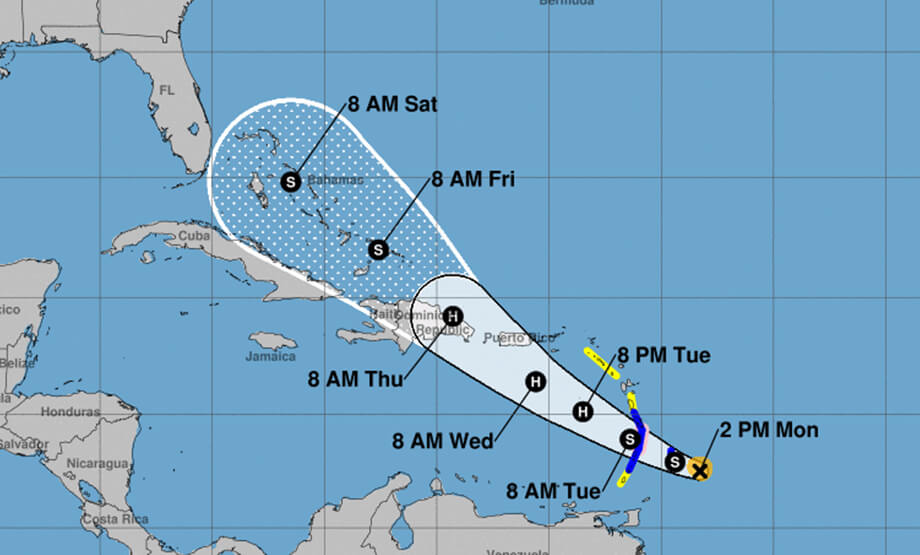
The Cone of Uncertainty describes the uncertainty of forecasting for specific events. It is widely used for project management and will give a good indication of the boundaries of the best and worst cases based on previous performances. Apart from project management, you can also use it to forecast hurricanes.
What is the Cone of Uncertainty?
The earlier you are in the development phase of complex products, the less you know and the more uncertain you are with how much can be done within a specific timeframe. Making estimations in this phase is a challenging task but usually very important for stakeholders.
As you progress in the development phase, you come to find the amount of work that can be done within a specific timeframe or sprint. This will make It easier to establish a reliable estimation of the project.
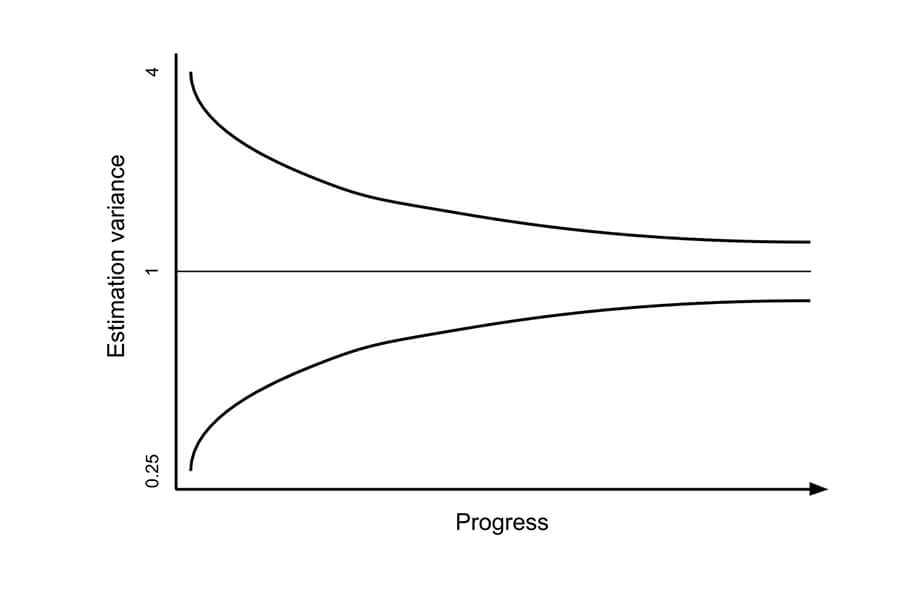
In project development, refer to the Cone of Uncertainty as being the time range between the worst and best-case scenarios of delivering a product, based on previous performances.
Why you should use it
In software projects, estimations are usually required by stakeholders before the start of the project. Because making an estimation at this point can be challenging, consider including a time-range for completing the project. Using the Cone Of Uncertainty can be a valid way to express the uncertainty of the estimation.
For new development teams, it can be even more challenging to make estimations, as they do not know how much work they can tackle within each sprint. Tracking the work done with the use of burn-down or burn-up charts is an essential method of getting insight into the work that can be done within a timeframe. Based on that data, making new estimations becomes easier.
How to determine the Cone of Uncertainty
The Cone Of Uncertainty is based on previous performance, and can only be used in development projects when there is data on the work done each sprint.
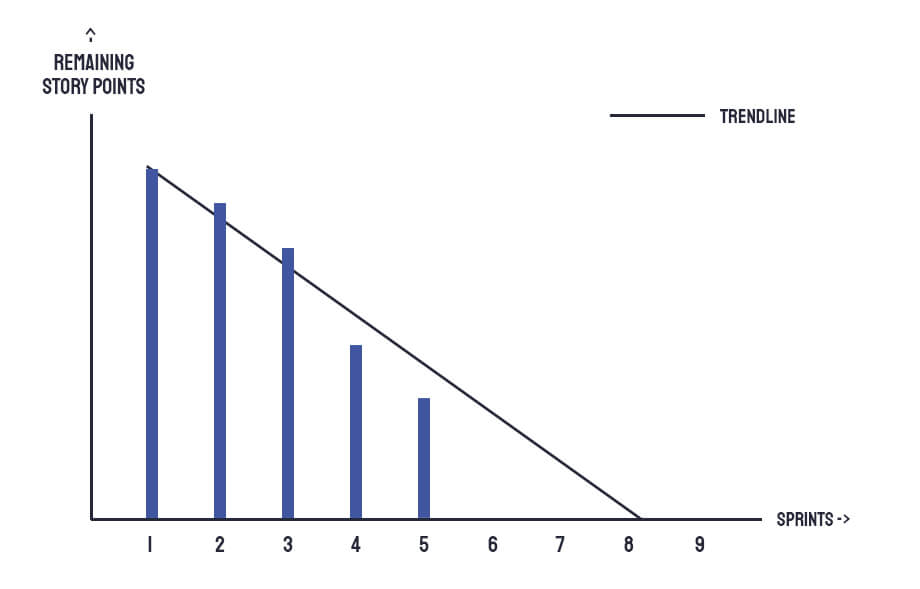
Let’s start with the example above. There is data on the remaining story points for 5 sprints. Let’s assume there are no newly added story points during this project. A basic trendline can easily be plotted to show an average scenario. But how do you determine the range of best and worst-case scenarios? That’s where the Cone of Uncertainty comes is.
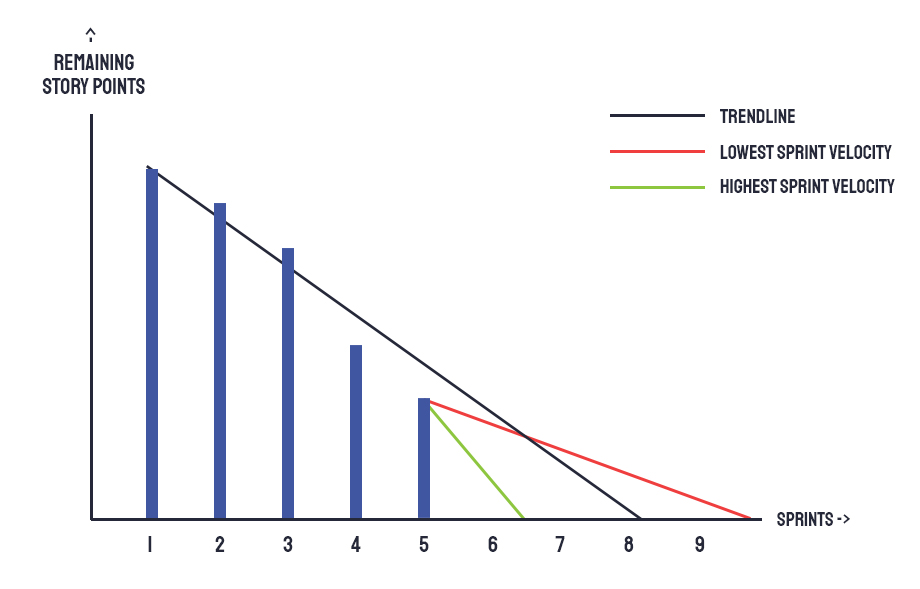
Determine the average velocity of the thee sprints with the lowest story points burned. Do the same for the three sprints with the highest story points burned. To establish the Cone of Uncertainty, you plot those two velocities from the latest known point in the chart.
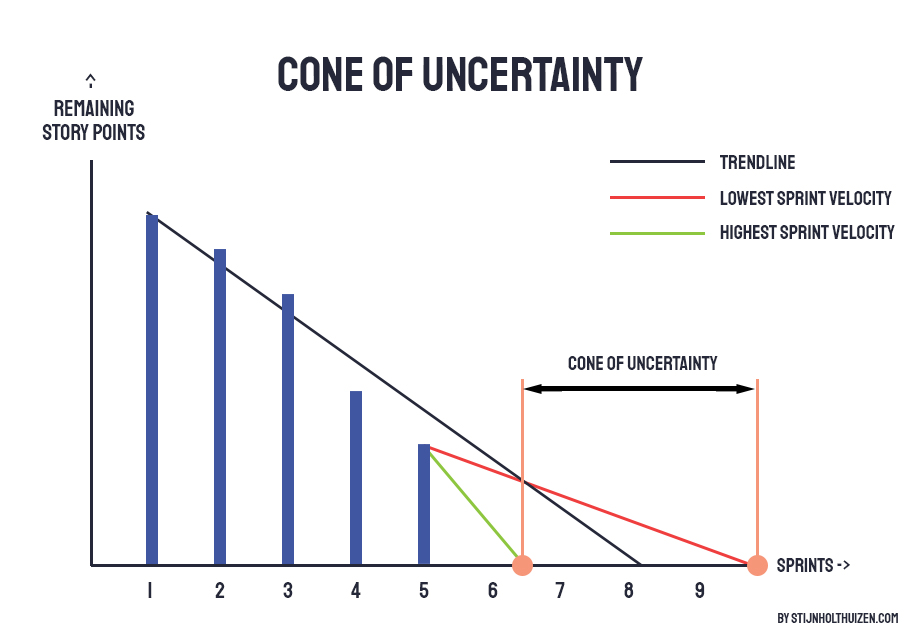
The spread of these lines is referred to as the Cone of Uncertainty.
Conclusion
The Cone of Uncertainty is a great tool to show the uncertainty within your estimations. However, it does not give insight into whether you’re going in the right direction and whether you are bringing value with the completion of the project. For this, bear in mind the Scrum Framework as described in Scrum Principles – The Agile Framework.